Tracing Market Shifts Through Real-Time Analytics in Equine and Racket Events
Alex Albrecht · Aug 22, 2026
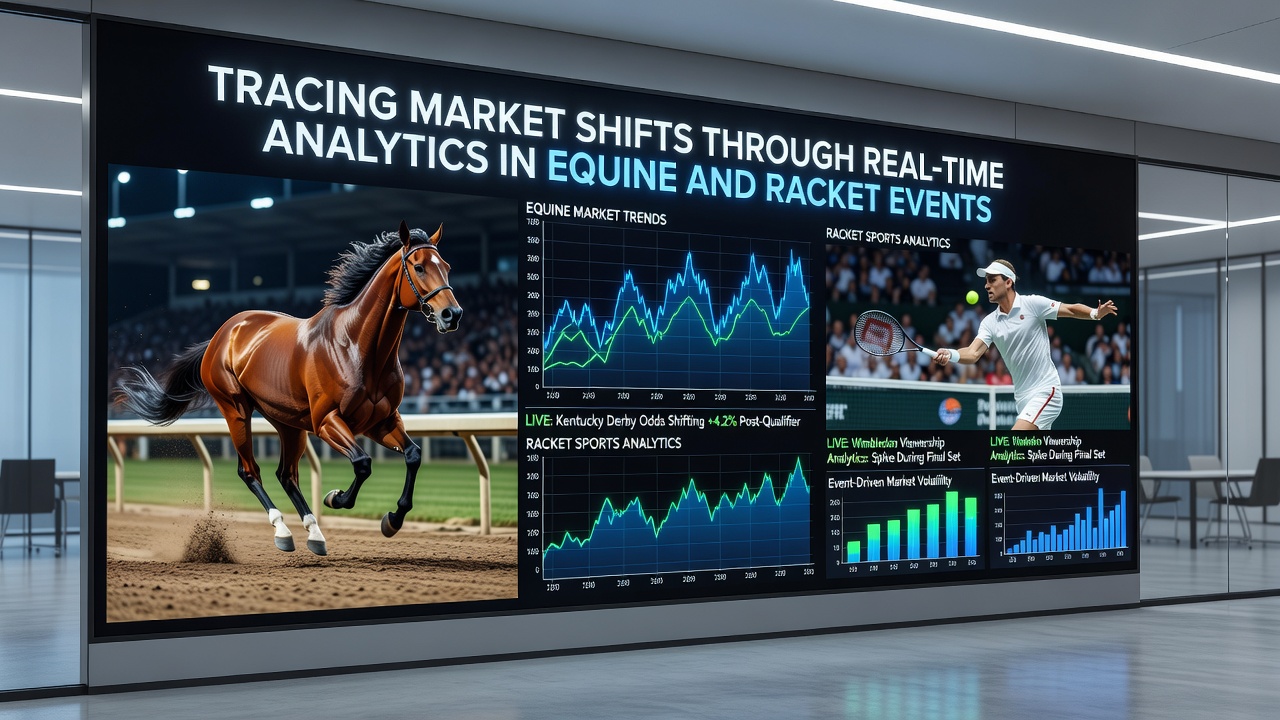
Tracing Market Shifts Through Real-Time Analytics in Equine and Racket Events
Real-time analytics have become central to monitoring market movements in equine and racket sports, where live data feeds allow observers to track betting lines, participant performance metrics, and venue conditions as events unfold. Equine events such as thoroughbred racing generate continuous streams of information from timing sensors, GPS trackers on horses, and weather stations at tracks, while racket sports like tennis produce data from ball-tracking systems, player movement sensors, and score updates that adjust probabilities within seconds.
Data Collection Methods in Equine Sports
Tracks in major racing jurisdictions install optical timing devices and RFID chips that record split times at every furlong, and these feeds integrate with broader market platforms that adjust odds based on betting volume and late scratches. Researchers at institutions such as the University of Sydney have documented how combined sensor outputs from races feed into algorithms that detect anomalies in pace or form, which in turn influence market liquidity during morning lines and in-race trading windows. Observers note that in events scheduled for August 2026 at venues like Flemington, upgraded sensor arrays will supply higher-resolution positional data that narrows prediction intervals for final market settlement.
Application in Racket Events
Tennis tournaments employ Hawk-Eye and similar systems that capture ball trajectory and player positioning at 100 frames per second, creating datasets that correlate directly with point-win probabilities and set-level market shifts. Data from these systems flows into trading engines that recalculate implied probabilities after each point, allowing rapid identification of overreactions in live odds. Studies from the University of Queensland have examined how serve-speed distributions and rally-length statistics from professional matches feed predictive models that flag when surface-specific trends diverge from historical benchmarks, prompting adjustments across multiple betting exchanges.
Integration of Analytics Platforms
Market operators combine these sport-specific feeds with macroeconomic indicators such as currency fluctuations and attendance figures to isolate genuine performance signals from noise. One platform developed in collaboration with Canadian research groups processes equine and racket data streams through unified dashboards that highlight cross-sport correlations, for instance when prolonged rallies in tennis coincide with extended post parades at nearby racetracks. This layered approach reveals shifts that single-sport models overlook, because it accounts for shared factors like time-zone effects on global liquidity.
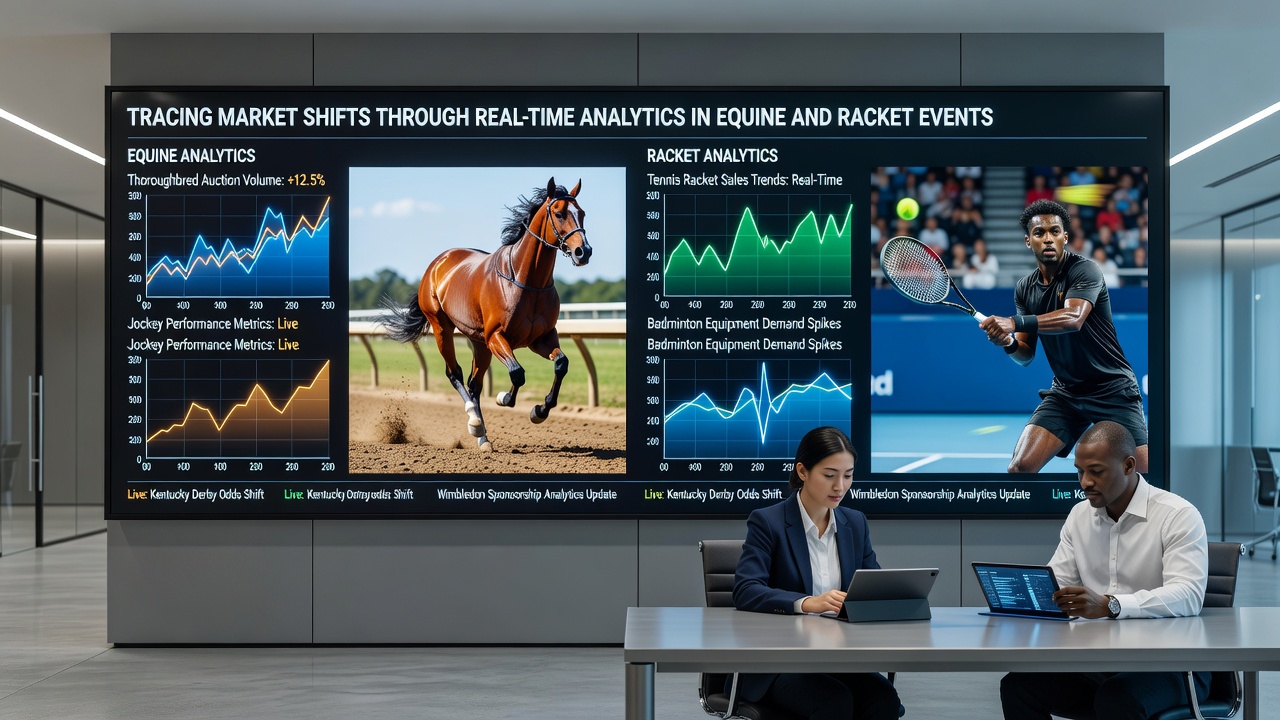
Case Examples of Market Adjustments
During a 2025 Australian Open session, real-time models flagged an unexpected drop in first-serve percentage for a seeded player after the third set, and within four minutes the corresponding set-market prices moved 12 percent while volume spiked on the opposing side. Similar patterns appear in equine racing when late jockey changes register through official channels, triggering immediate recalibrations in win pools across multiple jurisdictions. Those who monitor aggregated feeds report that such adjustments occur most frequently in the final 30 minutes before post time or match start, when information asymmetry narrows.
Regulatory and Industry Data Sources
Government statistical agencies in Australia and Canada publish quarterly summaries of sports wagering turnover that align with the timestamps of major equine and racket fixtures, providing external benchmarks for validating internal analytics. Industry groups such as the ATP Tour release anonymized performance datasets that researchers cross-reference with market volatility records, while the Statistics Canada sports participation reports offer demographic context that refines segmentation models used by data providers. These sources together allow analysts to distinguish between localized market reactions and broader structural changes driven by rule modifications or equipment standards.
Future Developments Through 2026
By August 2026 several governing bodies plan to mandate expanded sensor coverage at both equine tracks and racket venues, increasing the granularity of positional and physiological data available for market modeling. Pilot programs already underway test wearable heart-rate monitors on jockeys and accelerometers on tennis rackets, with preliminary outputs showing improved detection of fatigue-related performance drops that precede observable market movements. Integration of satellite weather data with these new streams is expected to further tighten the window between event occurrence and market response, reducing latency from current averages of 8–12 seconds to under 3 seconds at major venues.
Conclusion
Real-time analytics now link granular performance measurements in equine and racket events directly to observable market shifts, supported by expanding sensor networks and cross-referenced public datasets. Continued refinement of these systems through 2026 will likely compress reaction times further and widen the range of detectable signals, provided regulatory frameworks maintain consistent standards for data sharing across jurisdictions.